Optimizing Applications
Profiling
To minimize overhead at runtime, monitoring information is gathered rather on a global application level and hence might not be sufficient to troubleshoot specific issues. In such a situation, the use of more focused profiling tools can be an option. Typically, such tools can focus on a specific aspect of an application (for instance CPU or Memory management), but they come with an additional overhead and should only be enabled when needed. Hence, they need to meet the following requirements:
- Switchable at runtime
- Use a communication channel not exposed to unauthorized users
- Not interfering or even blocking business requests
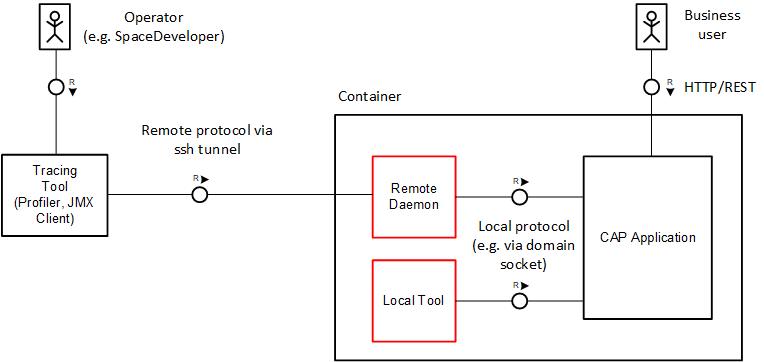
How can dedicated Java tools access the running services in a secure manner? The depicted diagram shows recommended options that do not require exposed HTTP endpoints:

As an authorized operator, you can access the container and start tools locally in a CLI session running with the same user as the target process. Depending on the protocol, the JVM supports on-demand connections, for example, JVM diagnostic tools such as jcmd. Alternatively, additional JVM configuration is required as a prerequisite (JMX).
Local Tools
Various CLI-based tools for JVMs are delivered with the SDK. Popular examples are diagnostic tools such as jcmd, jinfo, jstack, and jmap, which help to fetch basic information about the JVM process regarding all relevant aspects. You can take stack traces, heap dumps, fetch garbage collection events and read Java properties and so on. The SAP JVM comes with additional handy profiling tools: jvmmon and jvmprof. The latter, for instance, provides a helpful set of traces that allow a deep insight into JVM resource consumption. The collected data is stored within a prf-file and can be analyzed offline in the SAP JVM Profiler frontend.
Remote JMX-Based Tools
Java's standardized framework Java Management Extensions (JMX) allows introspection and monitoring of the JVM's internal state via exposed Management Beans (MBeans). MBeans also allow to trigger operations at runtime, for instance setting a logger level. Spring Boot automatically creates a bunch of MBeans reflecting the current Spring configuration and metrics and offers convenient ways for customization. To activate JMX in Spring, add the following property to your application configuration.:
spring.jmx.enabled: trueIn addition, to enable remote access, add the following JVM parameters to open JMX on a specific port (for example, 5000) in the local container:
-Djava.rmi.server.hostname=localhost
-Dcom.sun.management.jmxremote
-Dcom.sun.management.jmxremote.port=<port>
-Dcom.sun.management.jmxremote.rmi.port=<port>
-Dcom.sun.management.jmxremote.authenticate=false
-Dcom.sun.management.jmxremote.ssl=false
Don't use public endpoints with JMX/MBeans
Exposing JMX/MBeans via a public endpoint can pose a serious security risk.
To establish a connection with a remote JMX client, first open an ssh tunnel to the application via cf CLI as operator user:
cf ssh -N -T -L <local-port>:localhost:<port> <app-name>Afterwards, connect to localhost:<local-port> in the JMX client. Common JMX clients are:
- JConsole, which is part of the JDK delivery.
- OpenJDK Mission Control, which can be installed separately.
GraalVM Native Image Support Beta
Since Spring Boot 3 it's possible to compile Spring Boot applications to stand-alone native executables leveraging GraalVM Native Images. Native Image applications have faster startup times and require less memory. CAP Java provides compatibility with the Native Image technology.
Learn more about Native Image support in Spring Boot.
If you want to compile your application as a native executable the following boundary conditions need to be considered:
The GraalVM Native Image build analyzes your application from the
mainentry point. Only the code that is reachable through static analysis is included into the native image. This means that the full classpath needs to be known and available already at build time.Dynamic elements of your code, such as usage of reflection, JDK proxies, or resources need to be registered with the GraalVM Native Image build. You can learn more about this in the GraalVM Native Image documentation.
Tip
Many runtime hints for reflection, JDK proxy usage, and resources are contributed automatically to the Native Image build. This includes
- Required reflection for event handler classes defined in application code.
- JDK proxies for interfaces generated from the application's CDS model by the CDS Maven Plugin.
Spring Boot automatically defines and fixes all bean definitions of your application at build time. If you have bean definitions that are created based on conditions on externalized configuration or profiles, you need to supply these triggers to the Native Image build.
CAP Java also creates various bean definitions based on service bindings. Therefore, you need to provide the metadata of expected service bindings at runtime already during build time. This is similar to the information you define in deployment descriptors (for example
mta.yamlor Helm charts). This information is also required to be supplied to the Native Image build.The Spring Boot Maven Plugin allows you to configure the Spring profiles that are used during the Native Image build. You can supply information to the Native Image Build in a
native-build-env.json, which you can configure together with the Spring profile. For example you can provide information to the Native image build in thenative-build-env.jsonwhich you can configure together with the spring profile in thesrv/pom.xml:json{ "hana": [ { "name": "<hana-binding-name>" } ], "xsuaa": [ { "name": "<xsuaa-binding-name>" } ] }xml<profile> <id>native</id> <build> <pluginManagement> <plugins> <plugin> <groupId>org.springframework.boot</groupId> <artifactId>spring-boot-maven-plugin</artifactId> <executions> <execution> <id>process-aot</id> <configuration> <profiles>cloud</profiles> <jvmArguments>-Dcds.environment.local.defaultEnvPath=../native-build-env.json</jvmArguments> </configuration> </execution> </executions> </plugin> </plugins> </pluginManagement> </build> </profile>
When using Spring Boot's parent POM, you can easily trigger the Native Image build by executing mvn spring-boot:build-image -Pnative. This builds a Docker image using Cloud Native Buildpacks including a minimized OS and your application. You can launch the Docker image by running docker run --rm -p 8080:8080 <srv-project-name>:<version>.
Tip
If you want to try out CAP's Native Image support you can use the SFlight sample application which is prepared for GraalVM Native Images. Note, that SFlight's native executable is built and configured to use SAP HANA and XSUAA by default. You therefore need to run it with the cloud profile and supply an SAP HANA and XSUAA service binding. Alternatively you can make corresponding adaptations in native-build-env.json and srv/pom.xml to build the native executable for a different set of service bindings and profile.